A gallery exhibit at pinkcomma (Boston) and WUHO (LA) speculating on the urban future featuring a mix of digital and paper media.
The Exhibit
Projections is a research exhibit about the past, present, and future of urban design speculation. The research traces twenty five themes across nearly 300 projects in a variety of media. Each research item is represented in two interactive tools for cross-referencing themes, a postcard showing the project’s visual representation, an art wall full of QR codes which links to the live project in the database, and static infographics highlighting the interrelatedness of each topic.
As the research team’s developer, I built and maintained the content management system for cataloging the research, coded the interactive projections in Processing, created the API’s (xml and json feeds) for the postcard and art wall content, and transformed that data using xslt to create the physical media.
Interactive tool #1 in Los Angeles
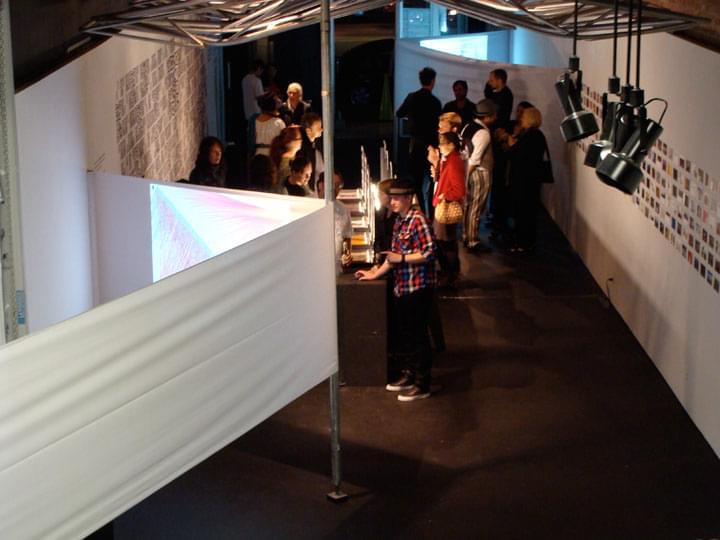
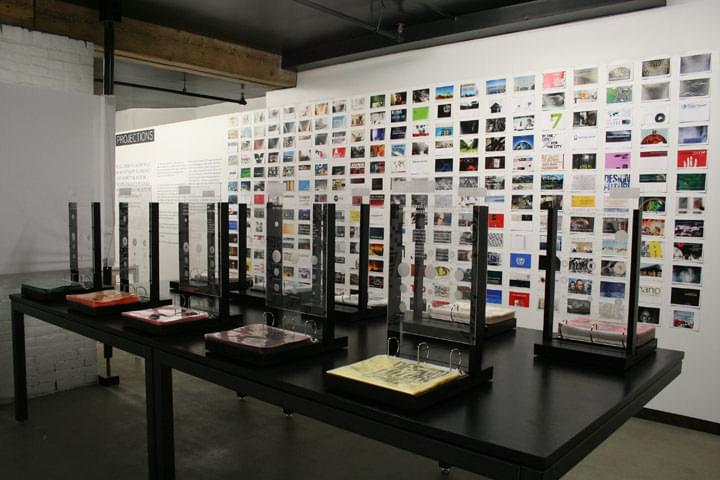
Full exhibit, Los Angeles
Interactive Tools
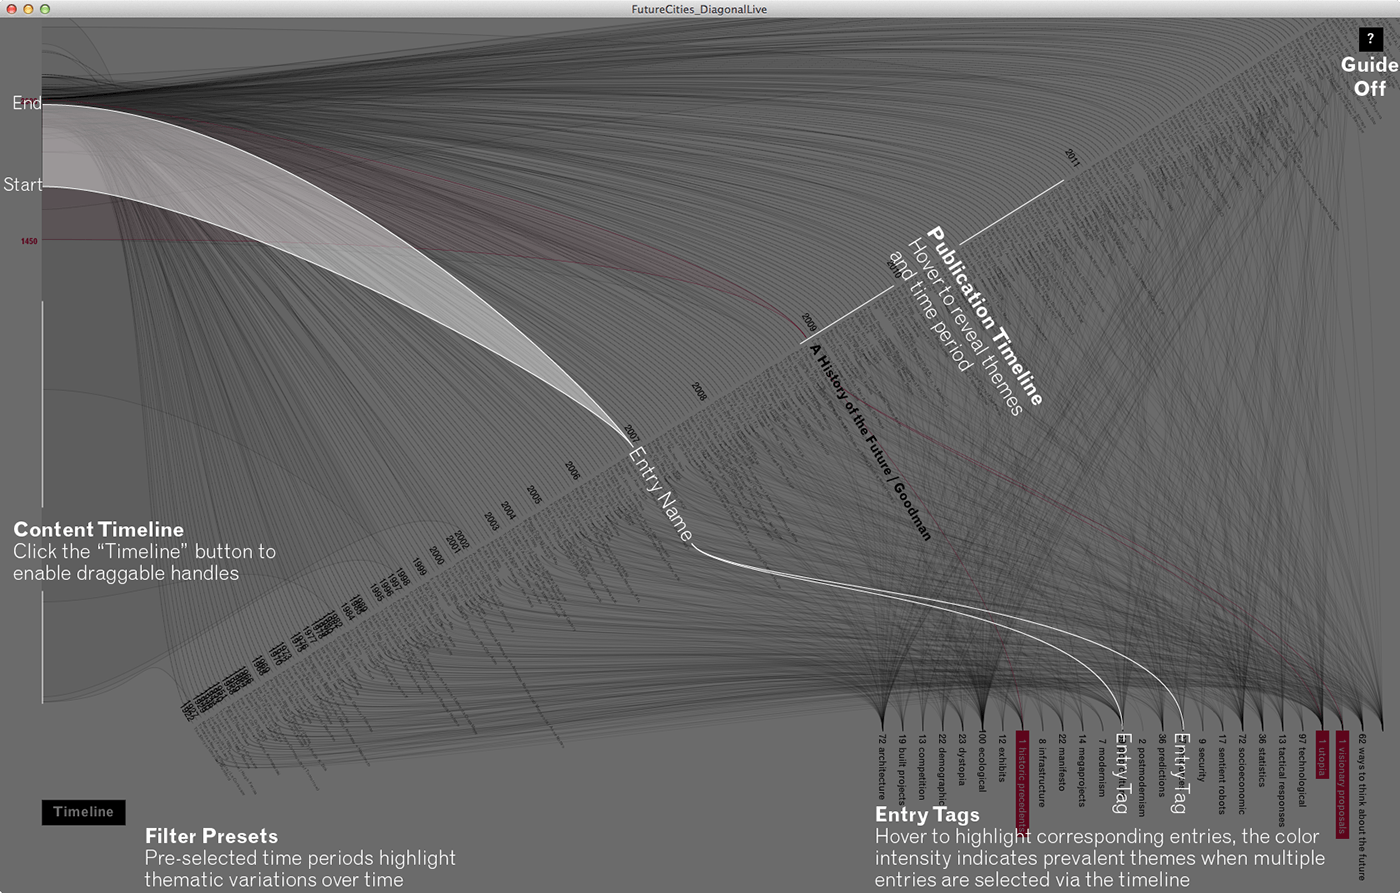
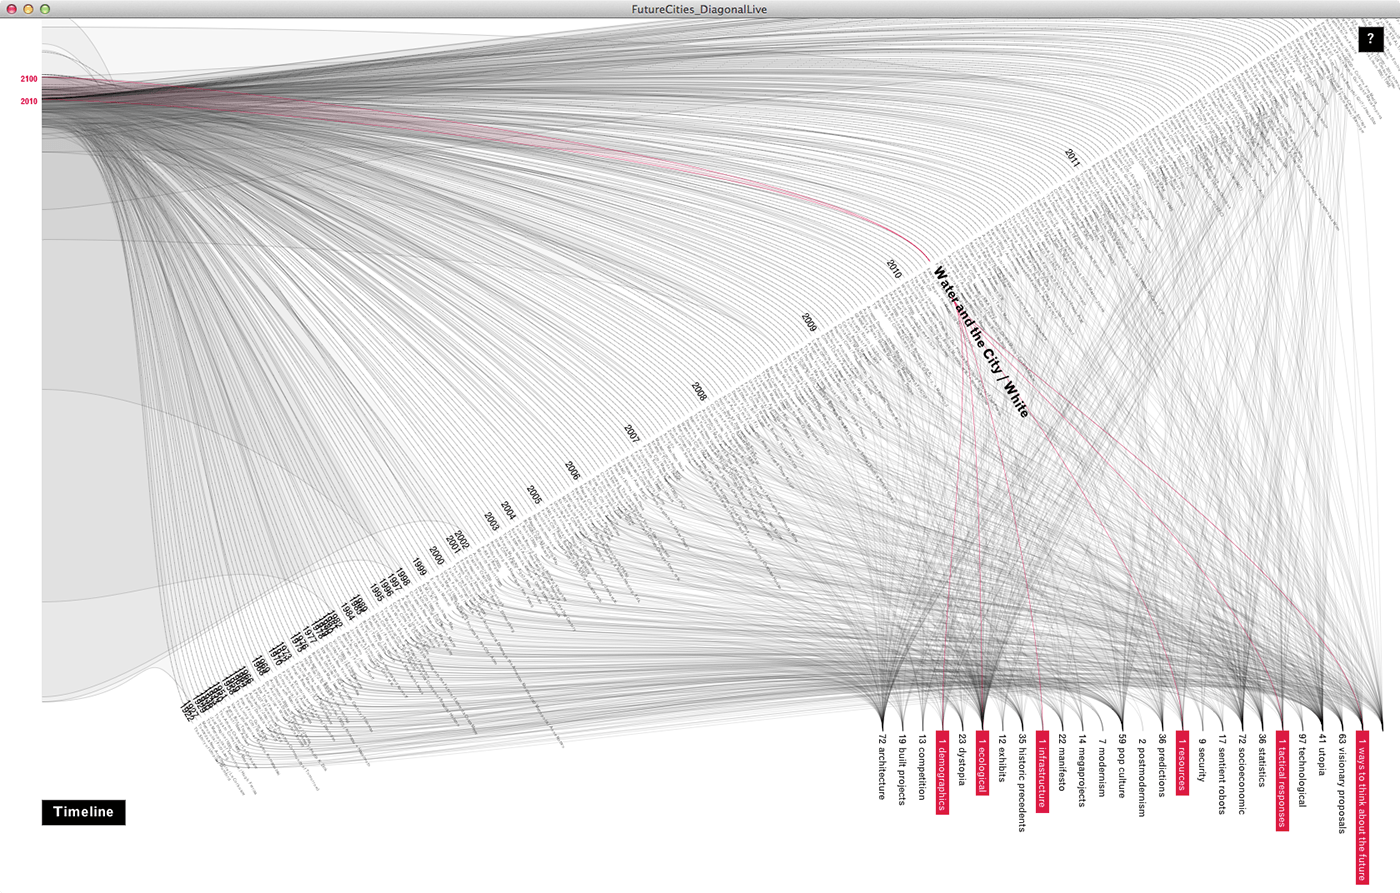
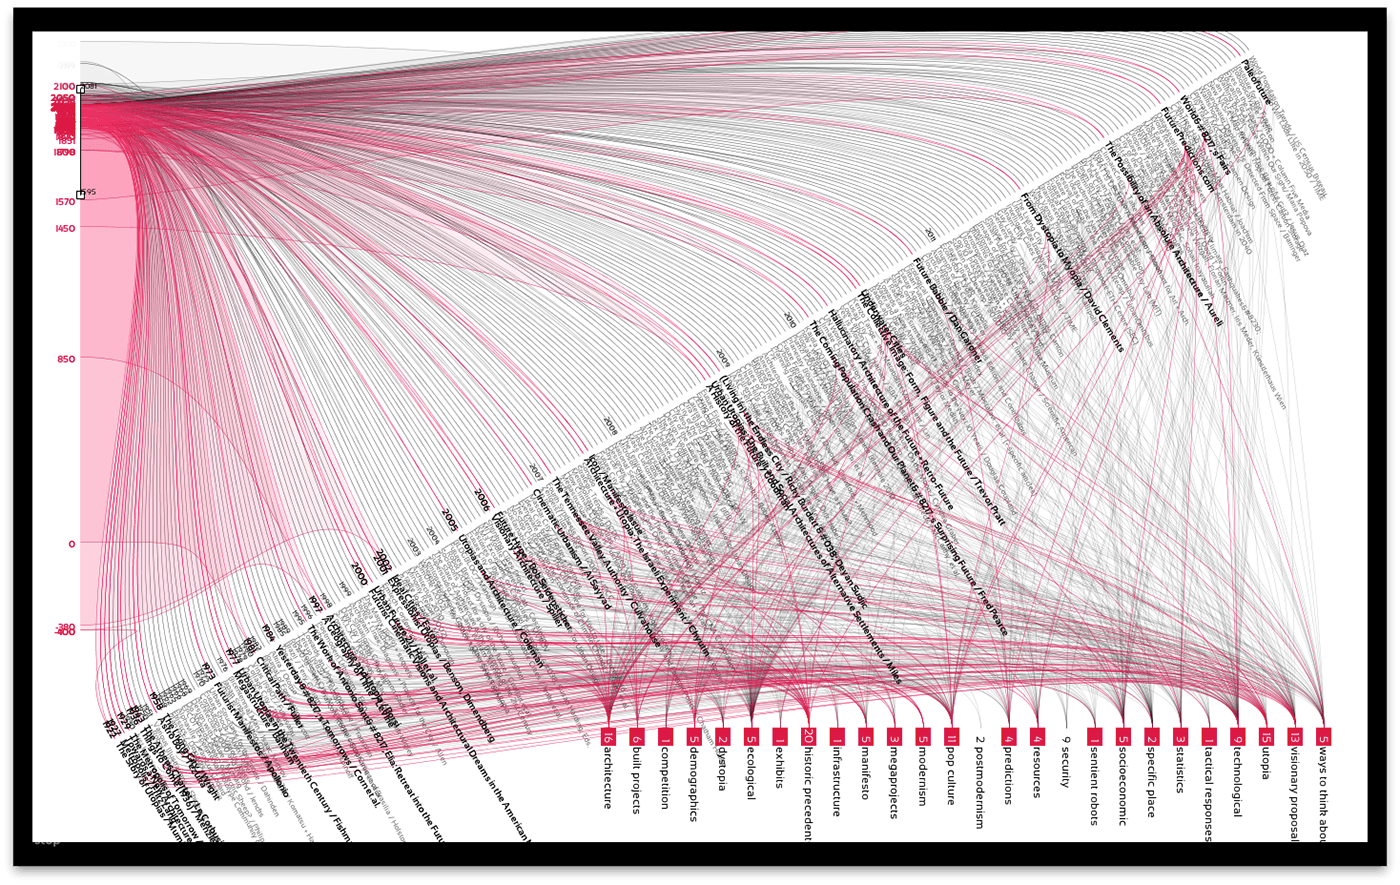
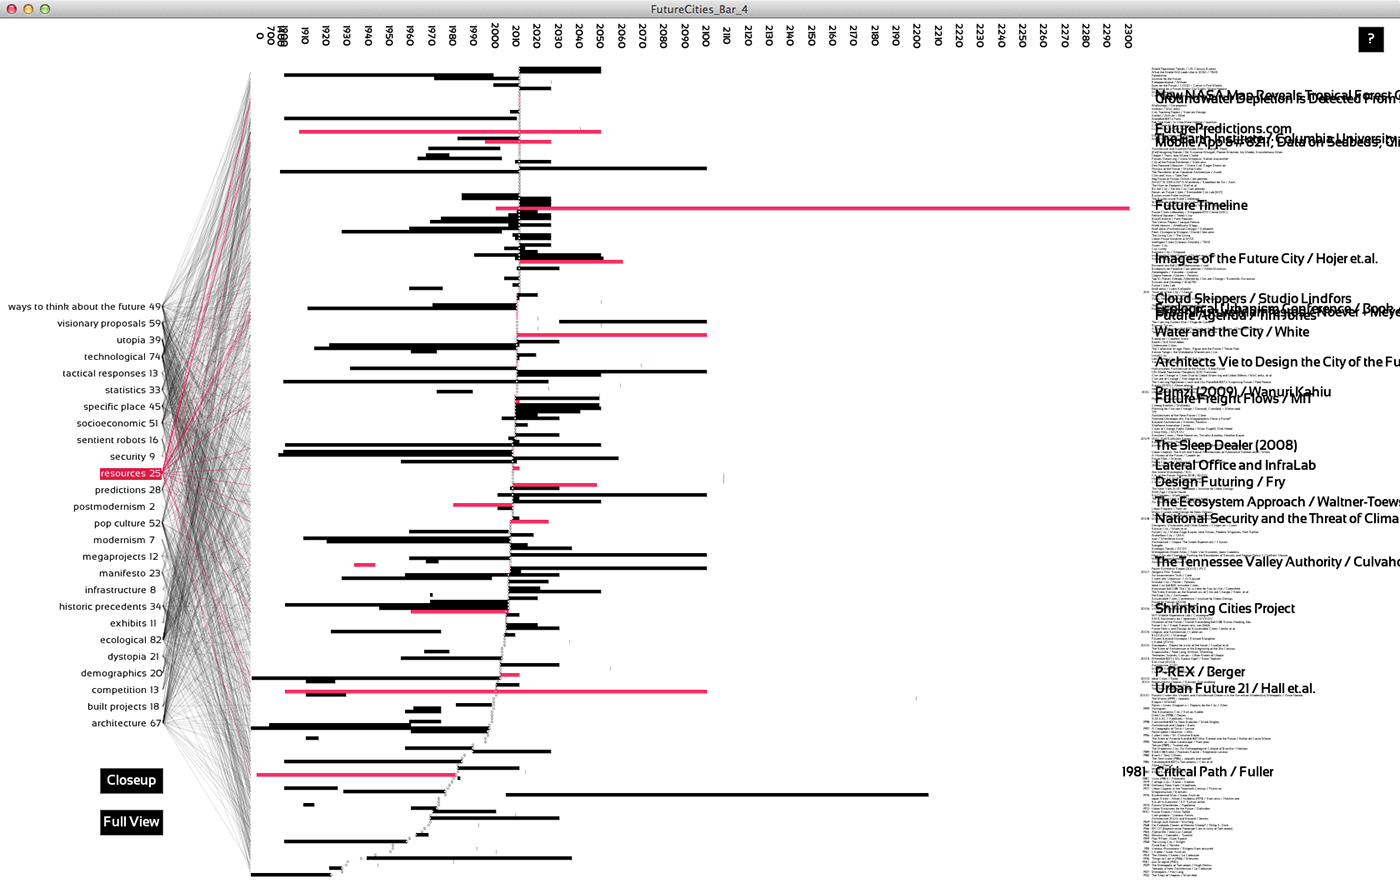
Developed in Processing to visualize the research archive behind Projections, these tools parse the database’s live XML feeds to bring the visitor a complete view of the research. Each entry in the archive is represented by it’s publication date, timeframe of study, and publication themes.
Interactive #1
This view maximizes the visual impact of connections between research topics and shows a broad view of the works included in the exhibit.
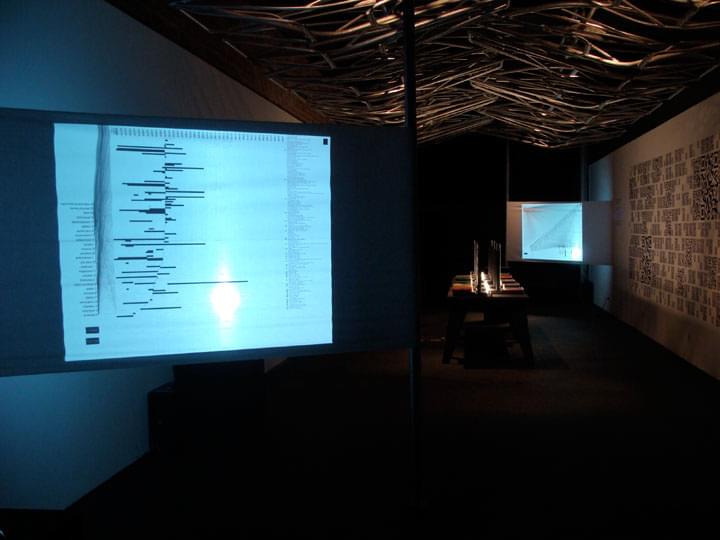
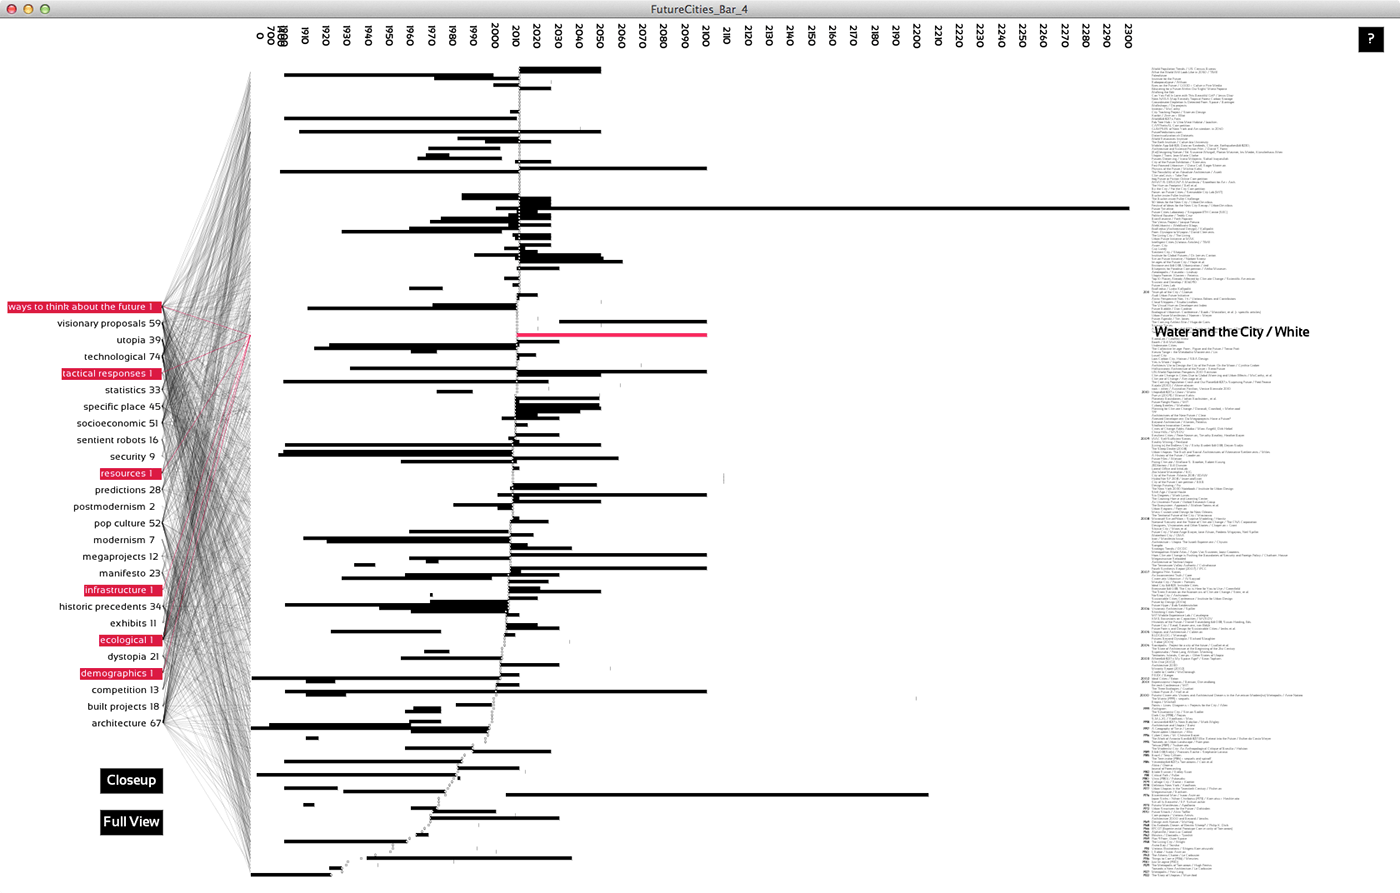
Interactive #2
This layout is zoomable and granular, highlightling project details more clearly. The user can also clearly compare a project’s publication mark against it’s scope to understand whether it is past-retrospection or future-speculation.
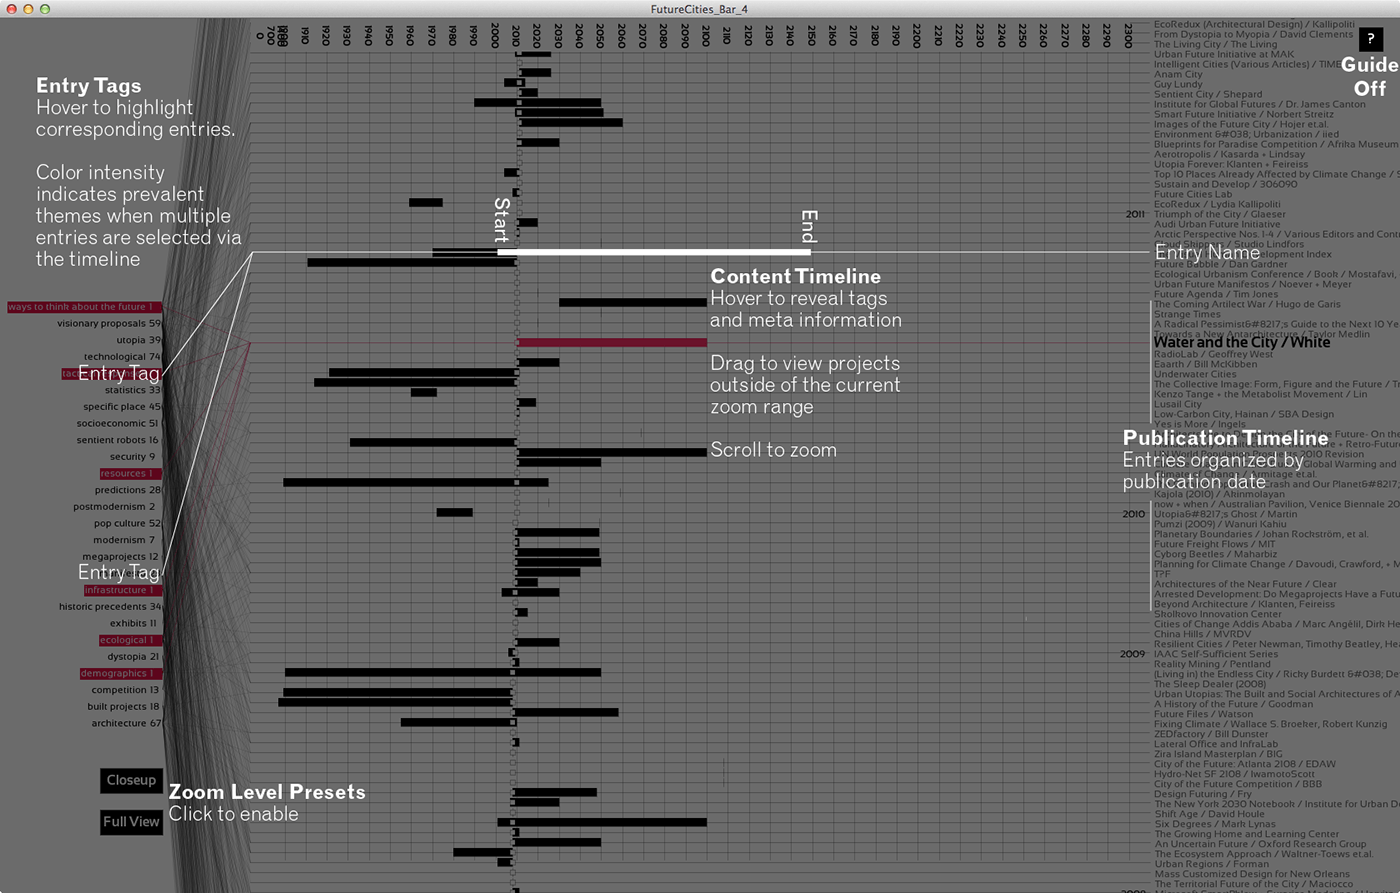
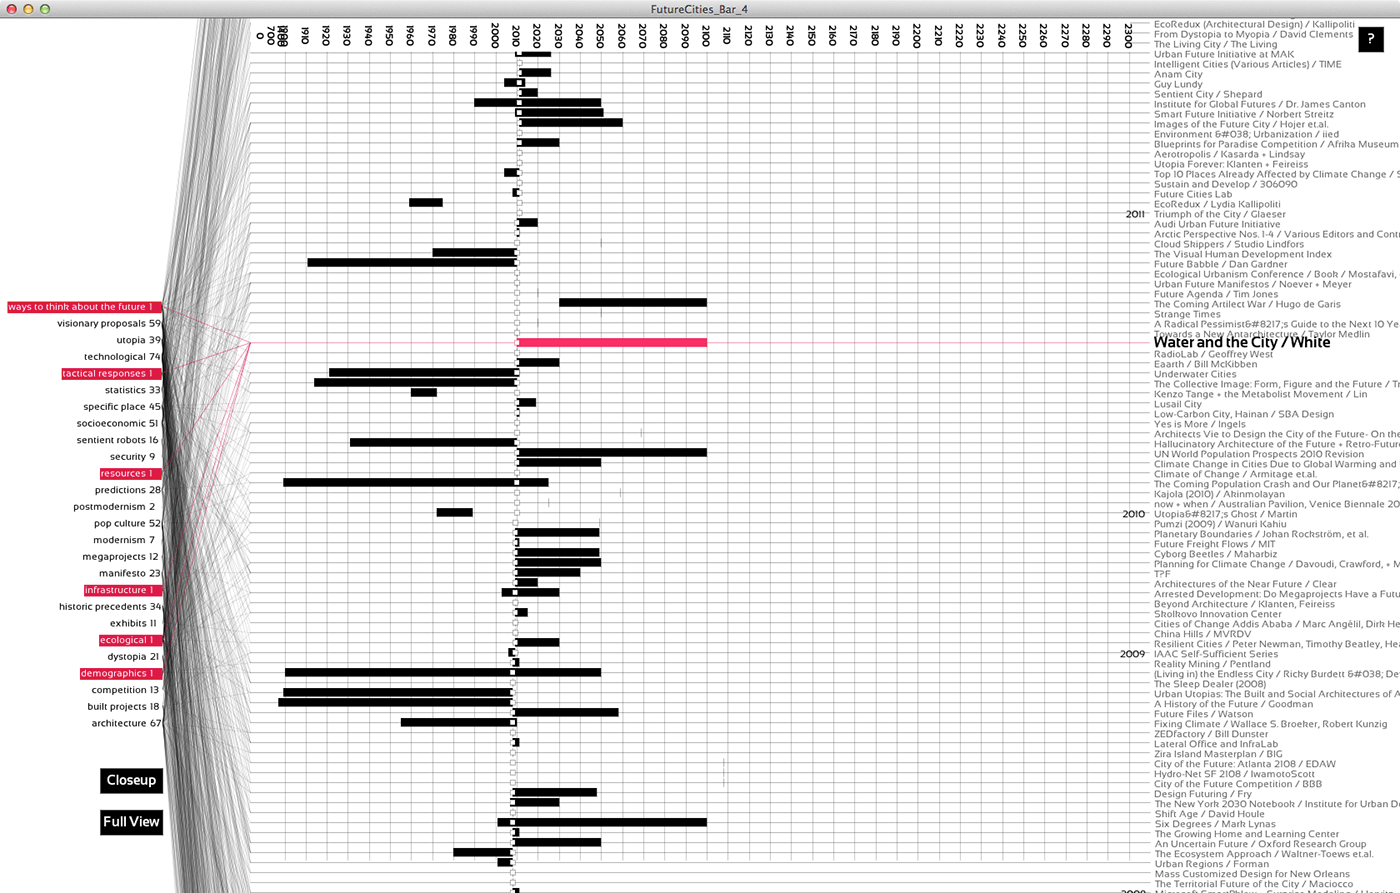
zoomed-in, highlighting a single entry
zoomed-out, highlighting theme
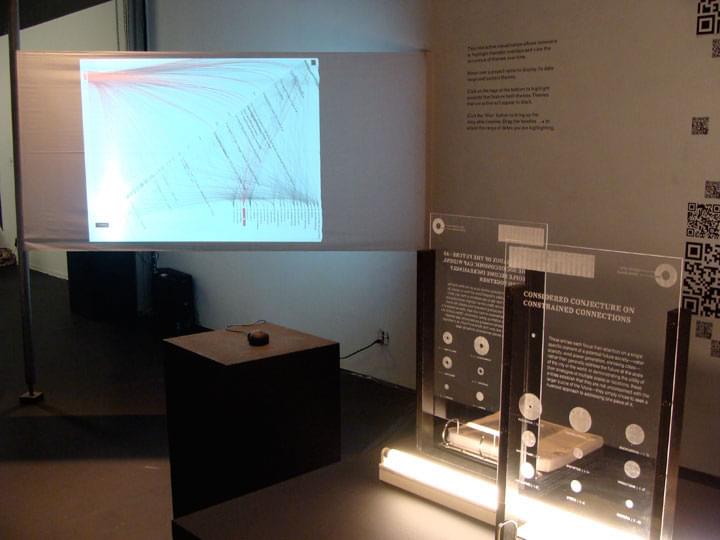
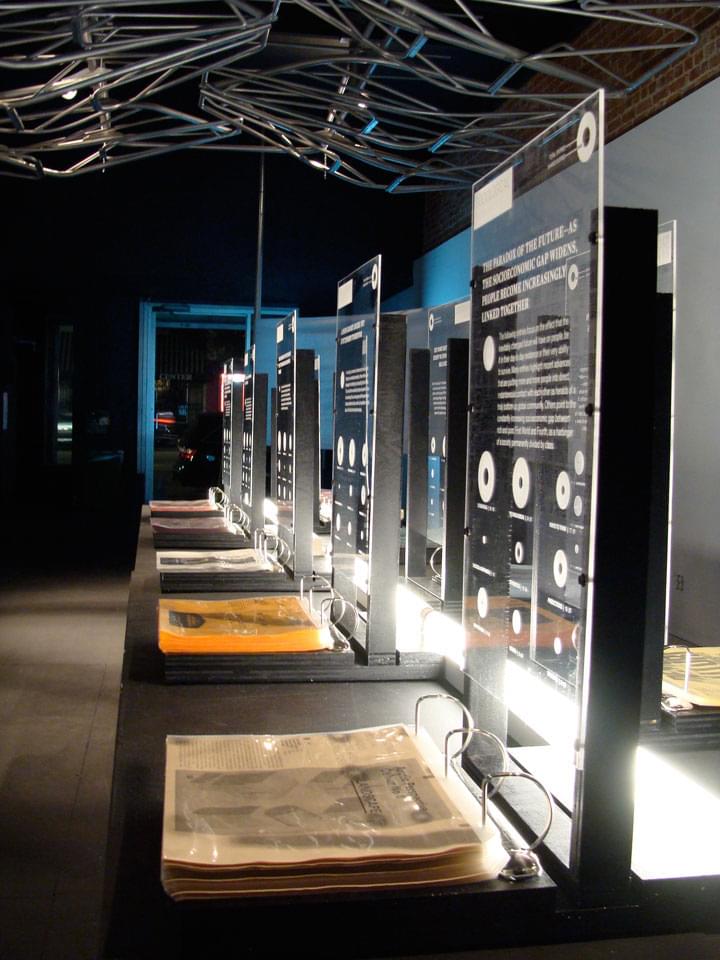
QR Wall, Postcard Walls and Tag Groups
Each of these physical installations shows the body of work in a specific facet. The QR code wall is a visual abstraction of each item, prompting the visitor to randomize their search; While the tag grouping is the collected prints of each entry in the database. Each is a physical collection meant to highlight the comparative ease of the same digital tool.
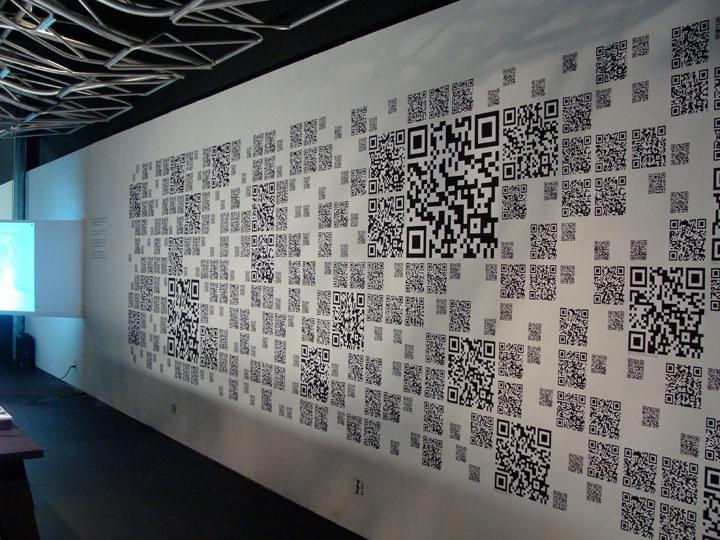
QR Code wall in LA
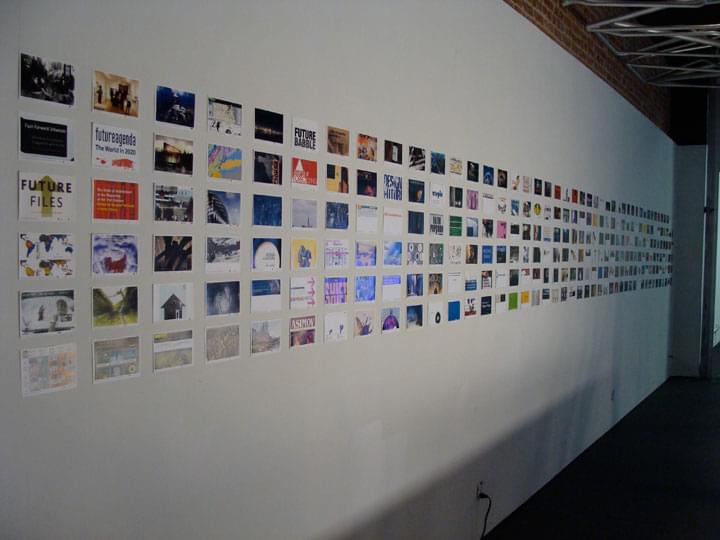
postcard wall in LA
database tags in LA
boston layout
Photo credits Mark Pasnik over,under
Built research catalogue tools and data structures (WordPress + structured data plugins)
Coded interactive tools from the underlying research (Processing, JSON APIs)
Converted SQL DB into QR codes, postcards, tag groupings (PHP,XML,XSLT)
Projections was exhibited at Pink Comma gallery in Boston, MA and the WUHO Gallery in Los Angeles
The Projections exhibit was developed as a member of the design team at over,under inc. in Boston, MA